Debugging the DPC++ debugger using Visual Studio® Code on Ubuntu
25 April 2023
The previous guides in this series, we setup the Visual Studio Code (VSCode) development environment on a Ubuntu 20.04 platform from scratch. The previous guides in this series are:
- Guide 1(Part 1)- Debugging SYCL™ code with DPC++ and Visual Studio® Code
- Guide 1(Part 2)- Setting up Visual Studio Code on Ubuntu for C++ development
- Guide 1(Part 3)- Setting up SYCL™ development with oneAPI™, DPC++ and Visual Studio® Code on Ubuntu
- Guide 2- Debugging the DPC++ debugger using Visual Studio® Code on Ubuntu
Introduction
This guide introduces a detailed view of debugging a Data Parallel C++ (DPC++) program using the VSCode IDE. The first section of two parts provides a breakdown of the explicit and implicit actions that occur during DPC++ program execution.
The second part of this article demonstrates how to use the VSCode IDE and its various extensions to provide an information rich view on the DPC++ program being debugged. The VSCode debugger with its suppporting extensions can provide additional debug information to that of using the Intel debugger gdb-oneapi from the terminal command line.
As of version 2023.0.0 of the Intel oneAPI Base Toolkit, Intel are predominantly using their icpx compiler in place of the dpcpp version. For the sake of continuity, when this guide mentions DPC++ program, it means a icpx compiled program.
Prerequistics
Before debugging, ensure the following:
- Ubunbtu 20.04 or newer.
- The Intel oneAPI Base Toolkit 2023.0.0 is setup and working.
- VSCode v1.75 is setup. See Guide 1 Parts 2 and 3 on how to do this.
- Install the VSCode extension NateAGeek Memory Viewer. The extension is referenced as part of the debugging exercise in this guide.
A very impportant part of the prerequistes, enter the following into any DPC++ project’s debug configuration found in the launch.json file.
  "setupCommands": [{
     "description": "Intel gdb-oneapi disable target async",
     "text": "set target-async off",
     "ignoreFailures": true
  }]
This command will prevent the gdb-oneapi debug session from hanging when it is asked to step into or over the SYCL function queue(DeviceSelector.select_device(),...).
The VSCode’s documentation is extensive and useful. The following documentation can support this article:
- Debugging https://code.visualstudio.com/docs/editor/debugging
- Debug C++ in Visual Studio Code https://code.visualstudio.com/docs/cpp/cpp-debug
- Configure C/C++ debugging https://code.visualstudio.com/docs/cpp/launch-json-reference
Build the array-transform program
The array-transform example from the Intel Getting Started series will be used to demonstrate a debugging session using the VSCode IDE. Use the following steps to prepare the array-transform example. You may wish to refer to Guide 1 Part 2 as it goes into detail of how-to setup VSCode with the Microsoft C/C++ extensions for DPC++ compiling and debugging.
The VSCode IDE provides several ways to develop and debug C++ code. This guide uses the Microsoft C/C++ extensions to manage a C++ project. When VSCode is mentioned on its own in this guide, it generally means we are using the Microsoft C/C++ extension pack.
Follow the steps to setup VSCode for this example:
- Optional: Follow the steps in Guide 1 Part 2 to create a simple VSCode C++ project.
- Create a new C++ project folder VSCodeDpCppArrayTransform.
- Copy the .vscode directory’s configuration files from an existing DPC++ VSCode project or create a new set of configuration files.
- Create the bin and src directories.
- Copy the array-transform code files to the src directory.
- Edit the project’s .json files; settings, tasks, and launch to create configurations for debug and release builds of the code putting the binaries in the bin directory. See figures 1, 2, 3, and 4 for examples of these files.
 {
     "programName": "array-transform",
     "files.associations": {
     "string_view": "cpp",
         "regex": "cpp"
     }
 }
Figure 1: Project’s settings.json file – setting the program’s name
Figure 2: Project’s build configuration file tasks.json
{
     "configurations": [
     {
         "name": "C/C++: Intel icpx build and debug array-transform",
         "type": "cppdbg",
         "request": "launch",
         "program": "${workspaceFolder}/bin/${config:programName}_d",
         "args": [
             "${input:args}"
         ],
         "stopAtEntry": true,
         "cwd": "${fileDirname}",
         "environment": [],
         "externalConsole": false,
         "MIMode": "gdb",
         "setupCommands": [
         {
             "description": "Enable pretty-printing for gdb",
             "text": "-enable-pretty-printing",
             "ignoreFailures": true
         },
         {
             "description": "Set Disassembly Flavor to Intel",
             "text": "-gdb-set disassembly-flavor intel",
             "ignoreFailures": true
         },
         {
             "description": "Needed by Intel oneAPI: Disable target async",
             "text": "set target-async off",
             "ignoreFailures": true
         }
         ],
         "preLaunchTask": "array-transform Debug C/C++: Intel icpx build active file",
         "miDebuggerPath": "/opt/intel/oneapi/debugger/latest/gdb/intel64/bin/gdb-oneapi"
     }
     ],
     "inputs" : [
     {
         "id": "args",
         "type": "pickString",
         "description": "Program args",
         "default": "cpu",
         "options": [
         "cpu",
         "gpu",
         "accelerator"
         ]
     }
     ]
 }
Figure 3: Project’s debug configuration file launch.json
 {
     "configurations": [
     {
         "name": "Linux",
         "includePath": [
         "${workspaceFolder}/**"
     ],
     "defines": [],
     "compilerPath": "/opt/intel/oneapi/compiler/latest/linux/bin/icpx",
     "compilerArgs": [ "-fsycl" ],
     "cStandard": "gnu17",
     "cppStandard": "gnu++17",
     "intelliSenseMode": "linux-gcc-x64"
     }
     ],
     "version": 4
 }
Figure 4: Project’s Intellisense configuration file c_cpp_properties.json
-
As this example program takes arguments, edit the launch.json file to present a device option list to the user. Add the text as shown in figures 5a and 5b.
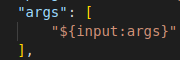
Figure 5a: Debug configuration, allow for arguments to be passed to the debug session.
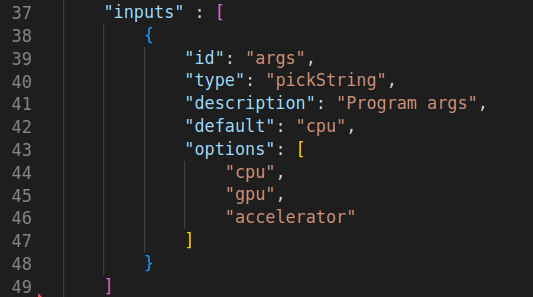
Figure 5b: Debug configuration, allow for arguments to be passed to the debug session.
- Select and build a debug build using ctrl+shift+b. Ignore any popups that may pop up i.e. Make.
- Check the program runs by using the debug terminal window and typing
./bin/array-transform_d.
Part 1: Examine a DPC++ program
The following detail is more than you need to debug the simple program provided however, this information will help provide a better understanding of the many implicit actions that occur during the program’s execution.
Code structure
We can view DPC++ programs as a nested set of three scopes: application, command group and kernel scope. This single source model code would follow the typical sequence in table 1 below. The kernel scope (figure 6) forms the innermost scope and represents the kernel code to be executed on a device.
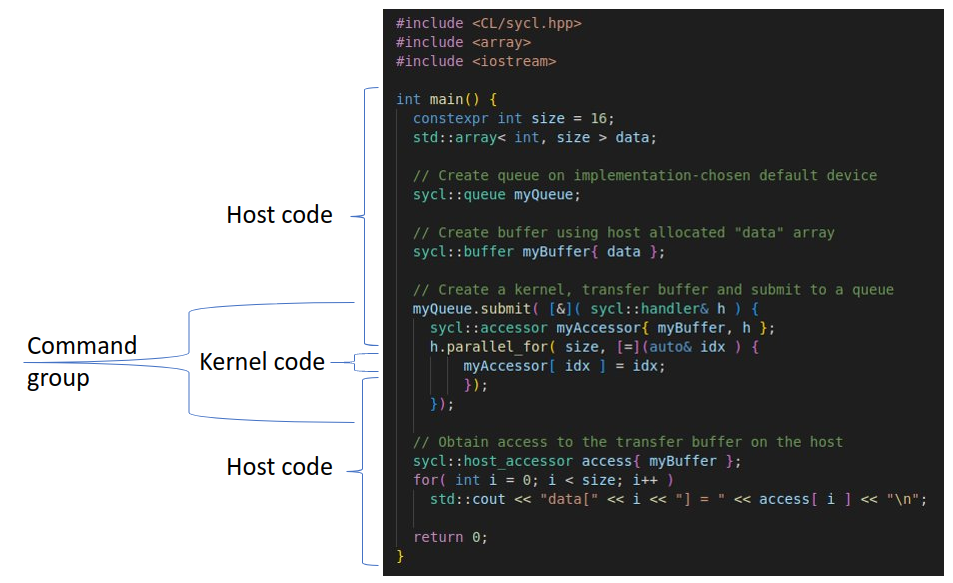
Figure 6: A typical DPC++ program’s structure.
Explicit and implicit actions
A typical SYCL platform as shown in figure 7 represents the underlying activity that occurs on the device driver(s) side or ‘backends’ with the DPC++ program executing on the host.
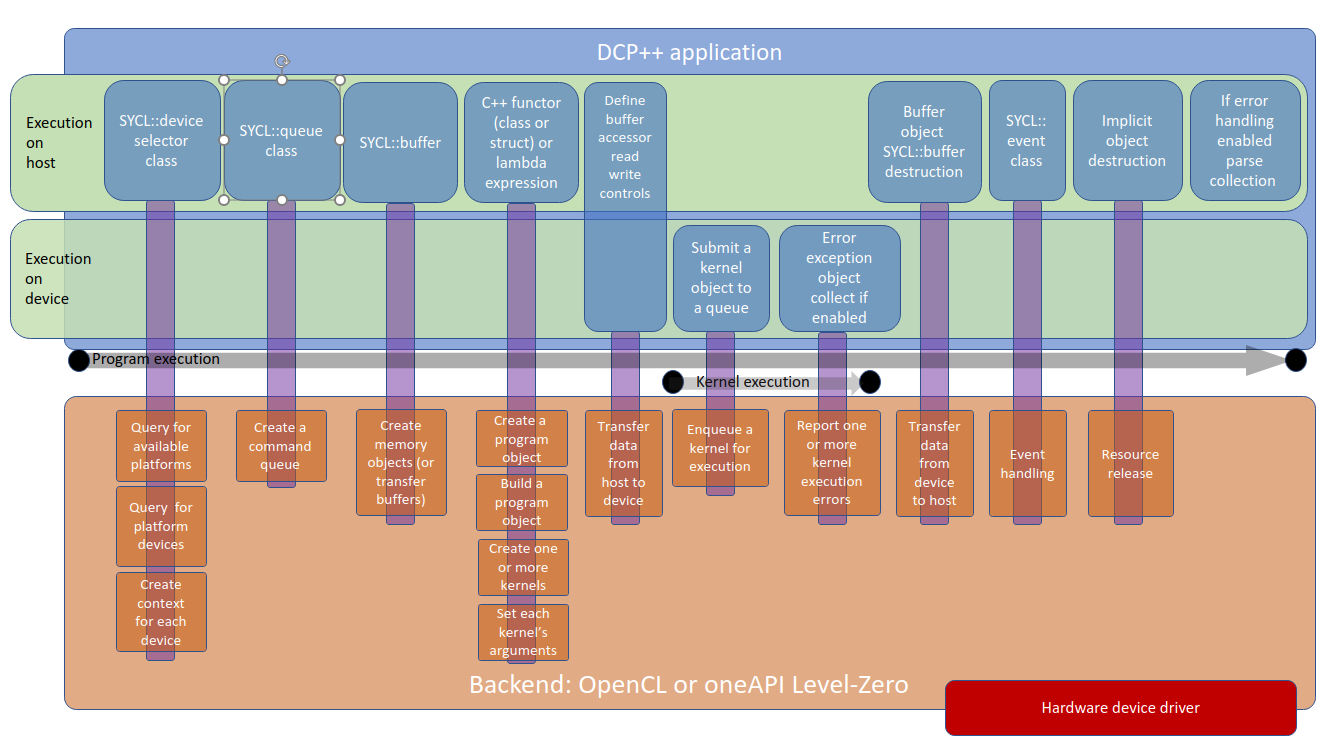
Figure 7: Order of activities and the interaction with the underlying ‘backends’.
Looking at the typical program above, table 1, breaks the flow of the program into the progression activities that occur. Figure 7 reveals the implicit activities that occur deep within the device driver layer.
| Steps | WWhere executed | DPC++ program | Function | Underlying ‘backend’ i.e. OpenCL library | Terminology |
|---|---|---|---|---|---|
| 1 | Host | sycl::device selector class | Represents a specific device to execute kernels (lambda functions) on. A device a can a CPU, GPU, FPGA or something else. It implicitly instantiates a device context(s). | Query for available platforms | A device context contains one or more devices. Contexts are used for managing objects such as command queues, transfer buffer memory, program, and kernel objects and for executing kernels on one or more devices specified in the context. |
| 2 | Host | Query one or more platforms for devices | |||
| 3 | Host | Create a context for each device | |||
| 4 | Host | sycl::queue class | Represents a queue to which kernels or sycl::queue functions (i.e. memcpy()) can be submitted (‘enqueued’) for work. Kernels or functions execute asynchronously from the host code. There is no expectation a queue’s work will start immediately and so the host code continues before the queue’s work starts. Kernels only start work when all dependences for execution are satisfied. | Create a command queue for a context | A command queue is an object associated with one device and a device context to which work is submitted. Different devices can have their own queue. Commands submitted to a command queue are queued in-order but may be executed in-order or out-of-order depending on the attributes specified during the command queue’s creation. Beware race conditions can occur between host and device code accessing the same data buffers out of expected sequence. SYCL’s USM data buffer model is prone to race conditions. SYCL’s Buffer model eliminates race conditions as the SYCL Scheduler examines the queue(s) for data dependencies. |
| 5 | Host | sycl::buffer class | Encapsulate a memory allocation that the runtime can use to transfer data between the host and the device. | Create memory objects (or transfer buffers) | |
| 6 | Host | sycl::handler class | Used to define a command group scope connecting kernels with buffers. | Command group means to perform work. A command group encapsulates one kernel with its dependencies, and it is processed as a single atomic entity once submitted to a command queue. A command group is defined either as a functor or as a lambda. | |
| 7 | Host | sycl::accessor class | Used to define buffer access requirements of specific kernels, e.g. READ, WRITE or READ-WRITE. | Transfer data from host to device and return results | |
| 8 | Host | sycl::range, sycl::nd_range, sycl::id, sycl::item, sycl::nd_item. | Represents execution ranges and execution agents within a range. | A range describe the iteration space where work groups and the work-items within those groups are composed to be executed. Work can be split up into smaller units of work, or several work-items divided into equally sized work-groups. Work groups can be on the same device or spread across different devices. Each instance of a kernel is referred to as a work-item. A work-item executes on ‘a single GPU execution unit’ or processing element (PE) in a compute unit. | |
| 9 | Host | C++ Lambda expressions or functors (a class or struct) | Create a program object | ||
| 10 | Host | Build a program object | |||
| 11 | Host | Create one or more kernels | Generally, it is assumed that kernels run asynchronously with the following traits: • Kernels will schedule execution according to data dependencies or data requirements, • Kernels will block when requesting data on the host, • Kernels handle memory operations automatically. The terms’ thread’ and ‘item’ are the equivalent. | ||
| 12 | Host | Set each kernel’s arguments | |||
| 13 | Target device | Submit a kernel object to a queue | Enqueue a kernel for execution | ||
| 14 | Target device | Kernels are executed across the device’s execution units (The host thread that submitted the queue can wait for kernels to complete execution). | 1 to N kernels are executed | ||
| 15 | Target device | Optional: Implicit asynchronous error exceptions collected if enabled. | Report 0 or N kernel execution errors. | ||
| 16 | Host | Buffer object sycl::buffer destruction | Transfer data from device to host. | ||
| 17 | Host | Optional: sycl::event class | Handle the device context’s generated events | ||
| 18 | Host | Implicit object destruction | Resources released | ||
| 19 | Host | Optional: If error exception enabled for collection parse the error list. |
Table 1: Order for activities between the host and device driven by the DPC++ program
A ‘backend’ is a hardware interface library that at a low level communicates directly with the hardware. Such a library could be an OpenCL driver or OpenGL driver written by the hardware vendor. For example, Intel has a driver called the oneAPI Level-Zero driver. A ‘backend’ can contain one or more acceleration device. Generally, the device driver API is based on an open standard like OpenCL. Using an open standard allows application developers to target many different vendors’ accelerator, yet still use the same software due to the standards’ common API.
Part 2: Debug the array-transform program
You may wish to refer to the following Intel debugging information pages:
- Tutorial: Debugging with Intel® Distribution for GDB* on Linux* OS host here.
- Tutorial: Debug a DPC++ Application on a CPU here.
- Tutorial: Debug a DPC++ Application on a GPU here.
The program array-transform processes elements of an input data buffer depending on whether they are even or odd, and outputs the calculations of the kernels into a separate output buffer.
To demonstrate that kernels execute at any time in any order, the Intel example program is to be amended with some additional code. Modify the program as shown in figure 8, insert the code before the program’s try catch scope and recompile it.
constexpr size_t dataElementSize = sizeof( int );
constexpr size_t fenceSize1 = dataElementSize * 2;
constexpr size_t fenceSize2 = dataElementSize * 2;
constexpr size_t dataBufferSize = 64;
constexpr size_t memBlkDebugLength = dataBufferSize + fenceSize1 + fenceSize2;
// Initialize the input data buffer
int arrayInput[ dataBufferSize ];
for( int i = 0; i < dataBufferSize; i++ )
arrayInput[ i ] = i + 100;

// Initialize the (output data buffer) debug memory block wrapping
// the output buffer. The 0xffs are the debug fence.
int arraysDebugMemBlock[ memBlkDebugLength ];
for( int i = 0; i < memBlkDebugLength; i++ )
arraysDebugMemBlock[ i ] = 0xffffffff;

// Initialize the output data buffer content with something so easy
// to see changes in buffer content as and when written to.
int *ptrArrayOutput = &arraysDebugMemBlock[ 0 ] + fenceSize1;
for( int i = 0; i < dataBufferSize; i++ )
ptrArrayOutput[ i ] = 0xbbbbbbbb;

// Commence program and kernel execution...
Figure 8: Code to create an output buffer memory fence
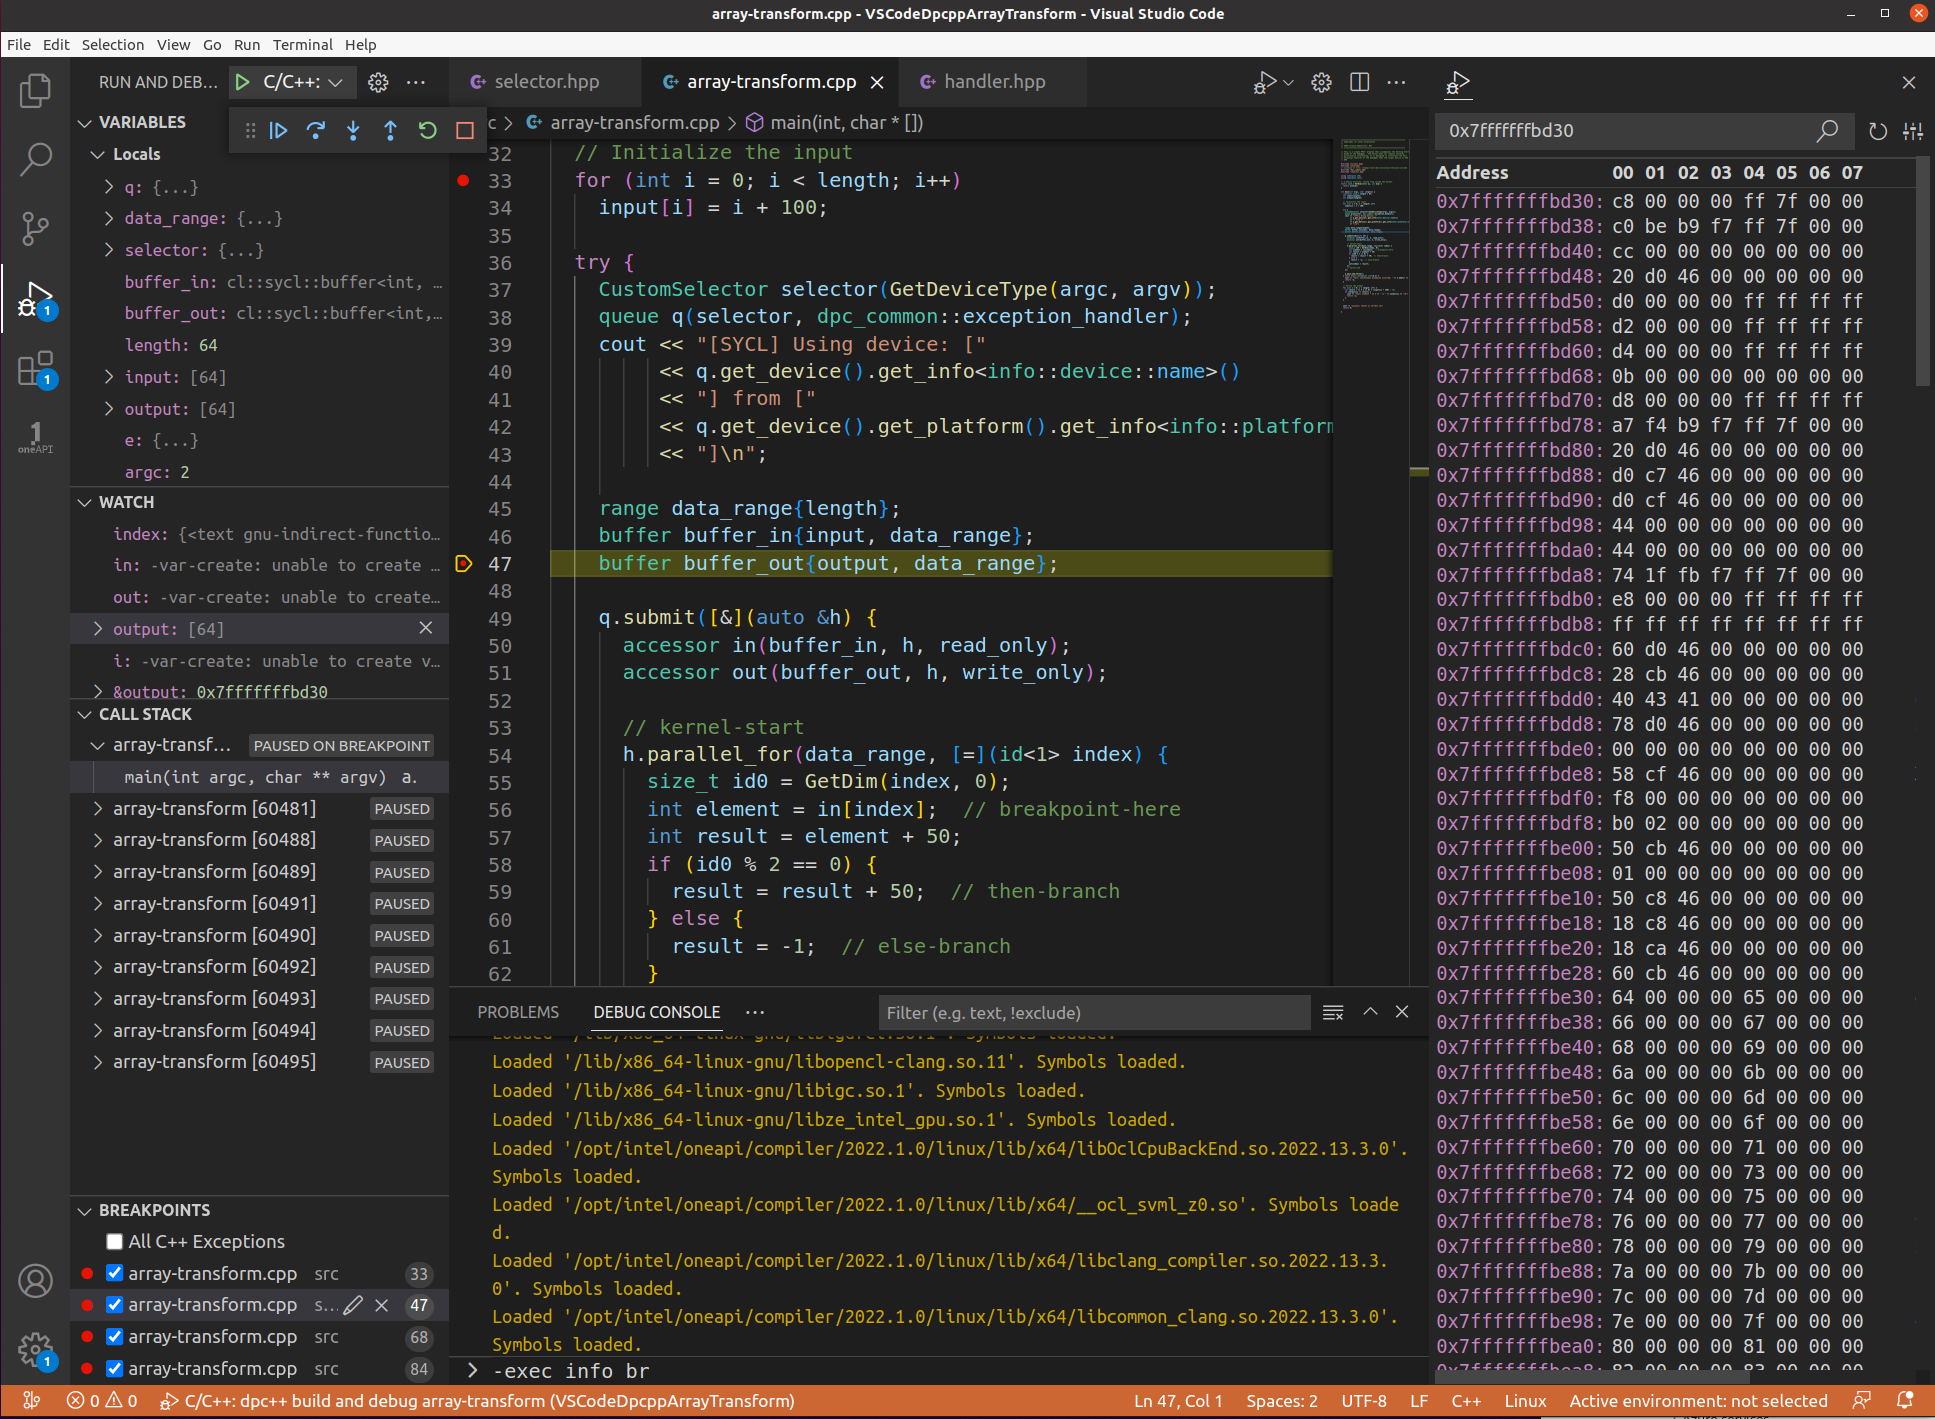
Figure 9 shows the NateAGeek Memory viewer pane. This is very useful tool that can be used to visually see host side buffers update as the data is copied from the device back to the host as the program iterates through the kernels.
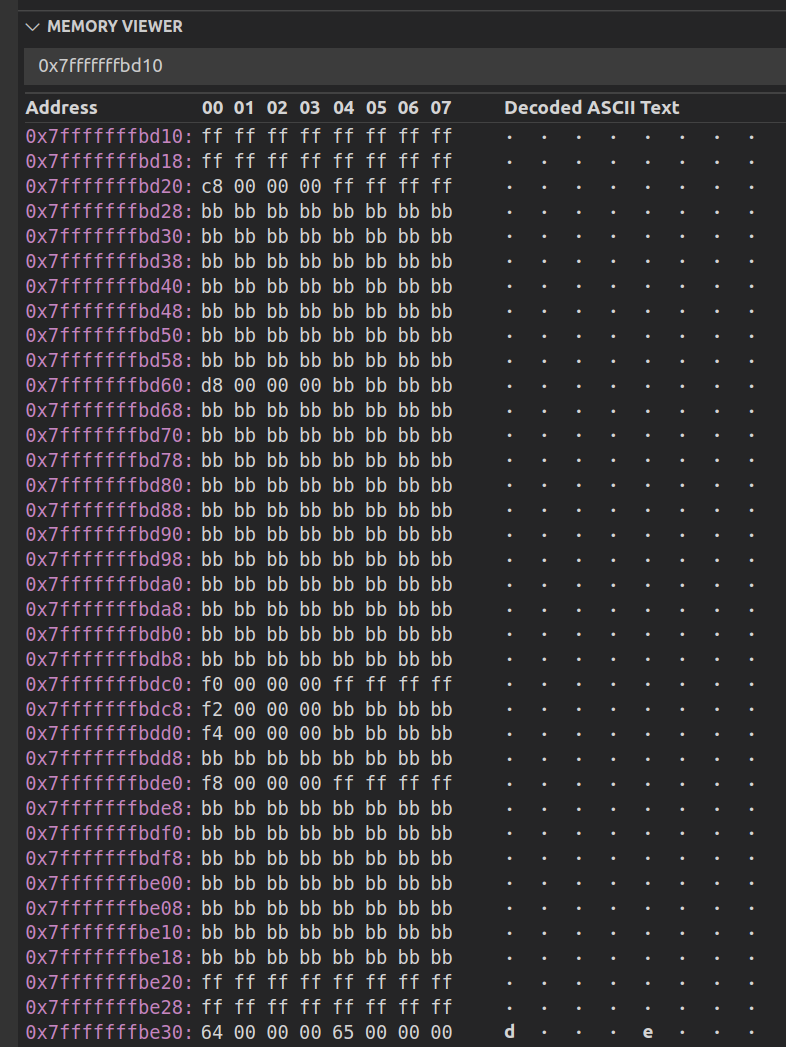
Figure 9: See the contents of the output data buffer change as kernels execute.
The simple memory fence used here is one technique that can be used to detect if any of the kernel writes to the host buffer extends past the buffer’s boundaries so causing memory corruption or fatal program termination.
Switch to the Visual Studio Code debug mode.
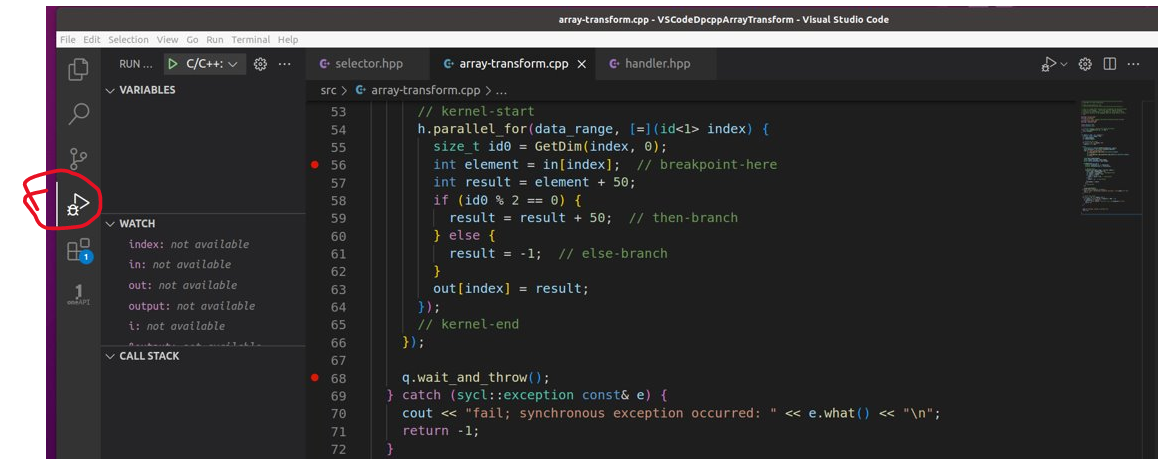
Figure 10: VSCode’s debug mode.
The VSCode debugger allows debug break points and variable watches to be added or removed at any time whether a debug session is running or not. Most types of break points and all watch expressions created in one debug session are persistent for future different sessions irrespective of the project workspace (VSCode folder) being closed and opened.
A break point is represented by a red dot in the left margin or gutter of the code line number. Click on the line and simply hit the F9 key or move the mouse cursor to the gutter left of the line number and click.
VSCode supports several distinct kinds of break points:
- Halt on reaching a line of code
- Halt on reaching a line of code when a condition is met
- Halt on entering a function
- Halt on visiting a line of code N times
- Halt on data changing at a memory location
Debug on the CPU
Before debugging the program, place a debug break point on first line of code after main().
Start a debug session. To debug the example for the first time, enter the IDE’s command palette (ctrl+shift+p) Debug: Select new debug session* and choose the debug version of the build. Subsequent debug sessions can be initiated by simply hitting the F5 key to start a new debug session. On the IDE prompting you to make a choice of the device to debug, choose CPU.
A quick summary of the VSCode debug keyboard shortcuts:
- To open the debugger window ctrl+shift+d
- Press F9 to set or toggle breakpoint on a selected line of code.
- Press F5 to start debugging or to run the application.
- Press F10 to step over.
- Press F11 to step into.
- Press shift+F11 to step out of the current function and return to calling function.
- Press shift+F5 to stop debugging.
- Press ctrl+shift+F5 to restart Debugging.
The program should halt on the line of the program where the new break point was placed. Reveal the terminal pane and select the DEBUG CONSOLE. Here will be displayed messages from the gdb-oneapi debugger.
Using the Intel array-transform example’s instruction notes as a reference, step through the code setting breaking points where you wish. The Intel article suggests putting a breakpoint pn the kernel code line const int element = ptrDataIn[ index ]; // <-- set breakpoint here. Do this and continue the program where it should now halt at the first break point visited.
The Intel article asks that the command print index be entered into the gdb-oneapi command line to see the contents of the variable index. This action can be achieved in VSCode by performing either:
- Typing exec print index in the Debug Console’s terminal pane prompt.
- Click the + icon in the debug watch pane and typing index.
- Mouse hover over a variable to display its contents.
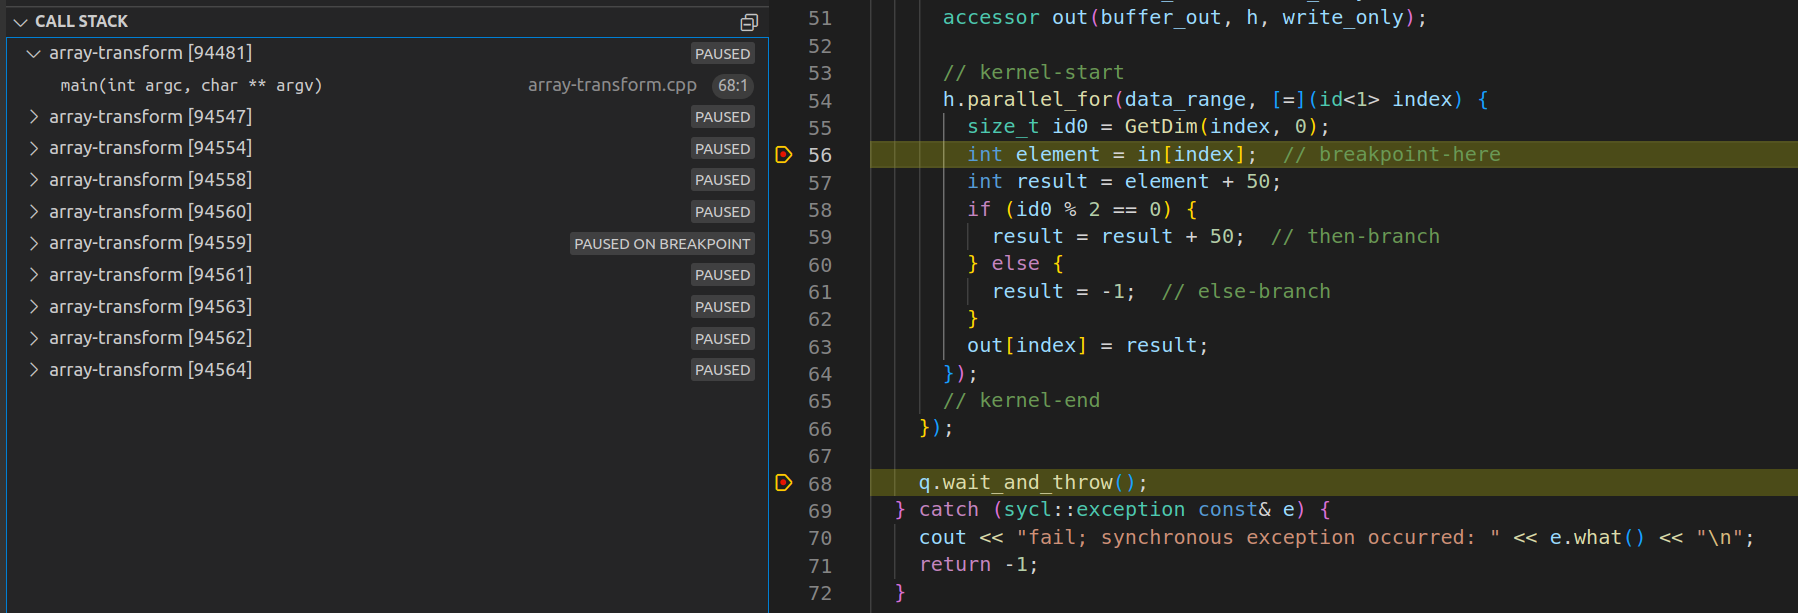 Figure 11: View of current set of threads (kernels) operating on the data range while halted at a line in the kernel code.
Having inspected the variable index, hit F5 again. The debugger will halt on the same line as before but by a different thread. The watch pane will be automatically updated as variable content changes. If using the NateAGeek Memory Viewer, be sure to refresh the memory view manually as it will not update automatically.
Like in Intel’s version of this project, debugging is not being stepped. Instead, a break point event is occurring on each thread being executed and so switches to the context of that thread. To step through the code of a single thread, the use the gdb-oneapi command set scheduler-locking step or on at the IDE’s debug console prompt. As this is not the main thread, be sure to revert this setting on returning to debug any host side code. Use the command set scheduler-locking replay or off.
To see the contents of the program’s accessor in, add it to the watch pane. By expanding the variable in, various aspects of the variable can be seen. Click on the variable in’s MData field to view the first memory address and its contents. Click on the variable’s Hex editor to reveal the contents of the memory at that location. If it asks to install an extension to do this then choose yes, let it install, and choose the MData field again, a new hex memory view pane will appear. Hover over any of the contents of memory will produce a popup displaying the hex number in a range of other number formats.
Monitor data movement between the device and the host
One of the defining characteristics of a SYCL program is that it creates a data buffer which can be shared with the host side code and the device side kernel code. As kernels execute processing incoming data, their results are placed in the various buffers, but in which buffers in which order? Is it one transfer (efficient) or several (inefficient)? We have the following buffers:
int output[length]buffer buffer_out{output, data_range}accessor out(buffer_out, h, write_only)
At what stage does the output buffer in this array-transform program start to see results of the kernels’ execution? We are going to be debug the program to find out. This debug session is going to use a combination of different break point types at various points in the program’s execution. This is because visibility of variables’ content (variable scope) only becomes available as the program executes. The following demonstration is best repeated several times exploring the range of possibilities that can occur, so broadly do the following steps while experimenting with enabling different break points in the code:
- Change to the Visual Studio Code debug mode.
- Remove all the break points that may exist in the program already.
- Reveal the debug console terminal output pane to see debugger messages as they appear.
- Place a break point at line
int arrayInput[ dataBufferSize ];. - Start a debug session and choose CPU as the acceleration device.
- In the variables pane under locals expand variable
outputand select[0]: -16928. - From the context menu choose break on variable change. A new break point will appear in the break points pane.
- In the watch pane add a new expression and type &output.
- Copy the address of the
outputarray and paste it into the NateAGeek Memory View, then hit refresh. - Take note of the content starting from this location (use a screen grab to take a picture).
- Place a break point at line
constexpr int dimension = 0;. - Continue program execution at let it halt at the break point at line
constexpr int dimension = 0; - In the variables pane choose
buffer_outand choose break on variable change. - The new break point has appeared in the break points pane but is not enabled. Hover over the break point to view the message.
- This break point will be not be enabled and so we cannot monitor
buffer_outfor changes. - Place a break point at line
result = result + 50;at let the program halt at that break point. - In the variables pane choose
outand create break point on variable change. - The new break point has appeared in the break points pane but is not enabled. Hover over the break point to view the message.
- Place break points at later stages on the kernel code. Remove the break point at line
result = result + 50;and let the program continue to execute.
Be sure to refresh the NateAGeek Memory View to verify that the contents of the output array have changed.
Observations and conclusion
The main thread does indeed wait on q.wait, however it can be observed the main thread being paused at any time before, during or after kernel execution when stepping through the code. A kernel break point can be visited before the same main thread break point is reached - it is undetermined as to which will be reached first. Once the program is continued, eventually the main thread will halt at the break point on q.wait. Meanwhile, kernels are executing asynchronously. Once all kernel break points are exercised, the main thread will not stop at q.wait again - it has already been there. It is recommended to place a break point on the next main thread execution code path away from any kernel execution to halt execution and so not end the debug session.
The output array can have its contents changed before the debugger can halt on a triggered data change break point which could make debugging ‘exactly when and where’ more time consuming. This would be especially the case if trying to see if a memory fence is touched.

Illya Rudkin
Principal Software Engineer
In This Series
This article is part of a series, please use links below to jump to different parts.
-
Guide 1Part 1Debugging SYCL™ code with DPC++ and Visual Studio® Code
-
Guide 1Part 2Setting up Visual Studio Code on Ubuntu for C++ development
-
Guide 1Part 3Setting up SYCL™ development with oneAPI™, DPC++ and Visual Studio® Code on Ubuntu
-
Guide 2Debugging the DPC++ debugger using Visual Studio® Code on Ubuntu
-
Guide 3Porting C++ projects to SYCL with DPC++ and Visual Studio Code
-
Guide 4Linking oneAPI libraries to a Visual Studio Code C++ Project