Using the Tracy Profiler with ComputeCpp
03 December 2020
When developing performance-sensitive applications, it is important to understand where are the critical parts of the code that can affect the performance. Good profiling support is paramount for any application aiming to be more efficient at solving a problem in constrained environments. Efficiency is context-dependant. It could mean lowering the power consumption of a battery in an embedded device or getting peak performance from the hardware in a supercomputer.
In the context of SYCL applications, there are a lot of things that can affect performance. How well is the application written? How well does the compiler understand your code? Am I using the right compiler flags? Could I be doing more work in parallel? Why is this kernel taking so much time to execute? What is my application doing while this kernel is running?
These are some of the questions that you might want to answer when developing your SYCL application. To help you answer these questions, we are adding native support for the Tracy Profiler to ComputeCpp Professional Edition.
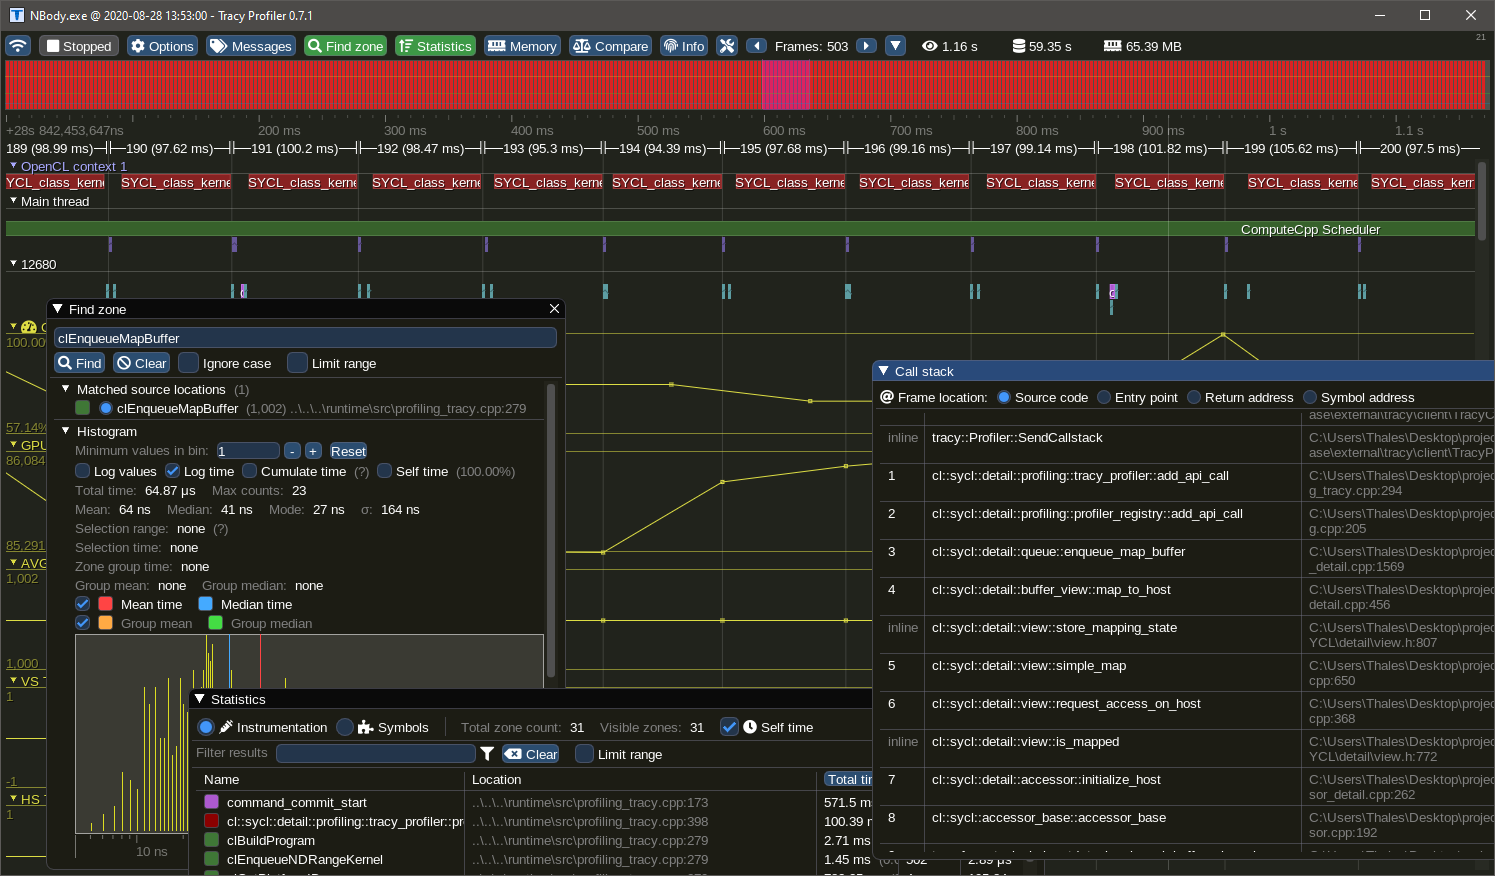
This is a screenshot of Tracy showing details of a profiling session for the NBody demo available in the ComputeCpp SDK.
Tracy Profiler
Tracy is a real-time, nanosecond resolution, remote telemetry, hybrid frame and sampling profiler for games and other applications. It is an open-source profiler that supports CPU (C, C++, Lua), GPU (OpenGL, Vulkan, OpenCL, Direct3D 12), memory locks, context-switches and more.
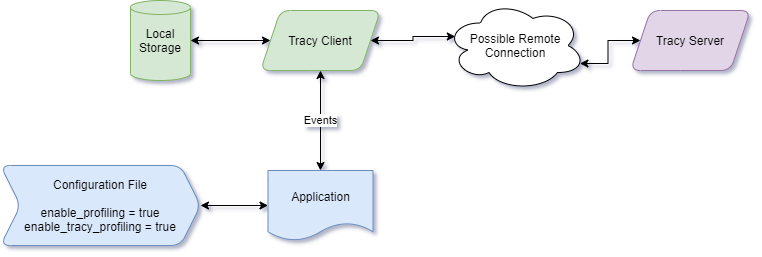
By adding native support for the Tracy profiler in ComputeCpp, you can connect Tracy to your application by simply enabling a configuration option. When connected, your application will immediately start sending data to Tracy, forming a nanosecond resolution execution profile that can be analyzed, searched and inspected.
Tracy can handle large amounts of data and it only requires RAM to be available in the machine running the server. Being designed as a client-server application, Tracy can be used to analyze remote applications, making it suitable to be used with embedded devices and development boards.
Enabling Tracy Profiler in ComputeCpp
In scenarios where remote profiling is not an option, due to network restrictions or lack of connectivity, it is still possible to use the ComputeCpp JSON profiler. After running the application, you can load the file in Google Chrome, the new Microsoft Edge browser or even Tracy itself as it supports importing files in JSON format.
The profilers in ComputeCpp are not mutually exclusive, this means you can have both a real-time capture with Tracy and a JSON file at the end of your application execution.
To enable Tracy, just add enable_tracy_profiling = true in your configuration file. Note that profiling is disabled by default, so you may need to add enable_profiling = true in the configuration file as well. When enabling profiling support, ComputeCpp automatically activates the JSON profiler, to turn it off, you can use enable_json_profiling = false.
Here is an example of a configuration file that will enable Tracy and disable the JSON output:
enable_profiling = true
enable_tracy_profiling = true
enable_json_profiling = false
The ComputeCpp integration with Tracy also supports the display of performance counter data. To enable performance counters, add enable_perf_counters_profiling = true to your configuration file.
Profiling your application with Tracy
You will now find a binary called Tracy.exe on Windows or Tracy on Linux when you download ComputeCpp Professional Edition. This binary is the Tracy server that is guaranteed to be compatible with the ComputeCpp in the package. Tracy uses a custom communication protocol, so the protocol version used in ComputeCpp must match the protocol version in the server application. For this reason, you must use the Tracy server included as part of the ComputeCpp PE release package to avoid any compatibility issues.
Example of a Profiling Session with Tracy
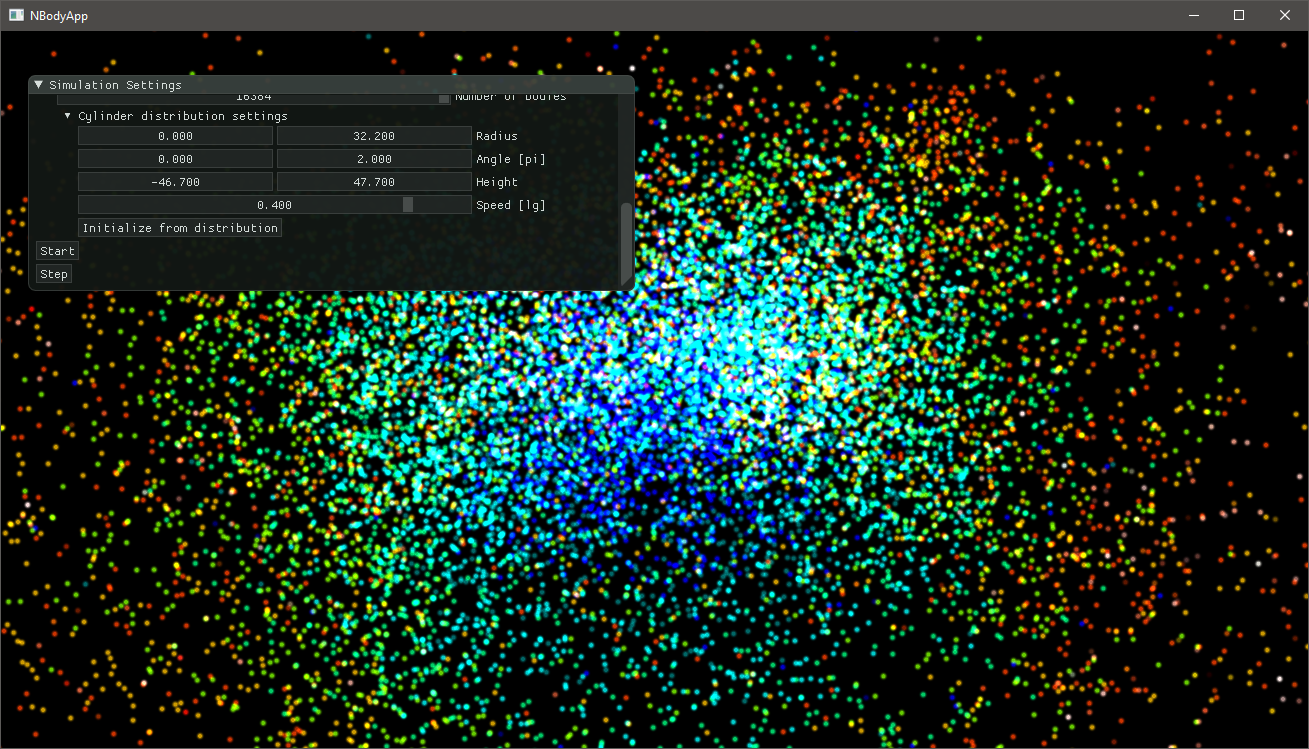
To demonstrate the capabilities of the Tracy integration with ComputeCpp, we selected the NBody simulation from the ComputeCpp SDK (see the screenshot below). This application is a good example because it launches many kernels every second and doesn't finish until it is interrupted.
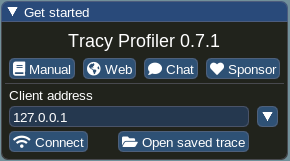
Opening Tracy will give you a configuration window. Here you can access the user manual, some useful links and a link to sponsor the project. For applications running on a remote machine, fill in the client address with the machine's IP address. You can also open a pre-recorded profiling session.
The communication between client and server is performed using port 8086. If this port is
already in use, it can be changed with the environment variable TRACY_PORT. Please refer to
the Tracy user manual for more information on remote profiling.
Improving Performance of the NBody Simulation
Let's take a closer look at the timeline of events generated by the NBody simulation demo. This demo uses an O(N2) algorithm where the interaction between every pair of bodies is computed using some force. By default, the demo uses the gravity force, so the number of particles is the only parameter that will affect kernel times. For this demonstration, the simulation is running with 16384 particles.
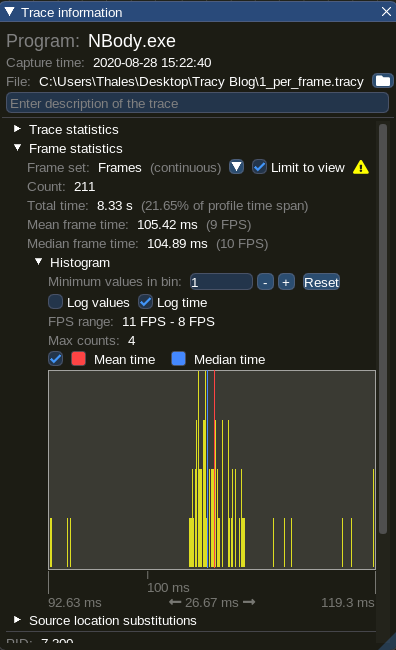
The first place to look for useful data is the "Trace Information" window. In this window we can see that the majority of the frames are concentrated around 105ms. This shows consistent kernel times and is expected due to the nature of the simulation.
Assuming kernel times cannot be further reduced, since the times are consistent, let's take a look in what is going on in between kernel executions.
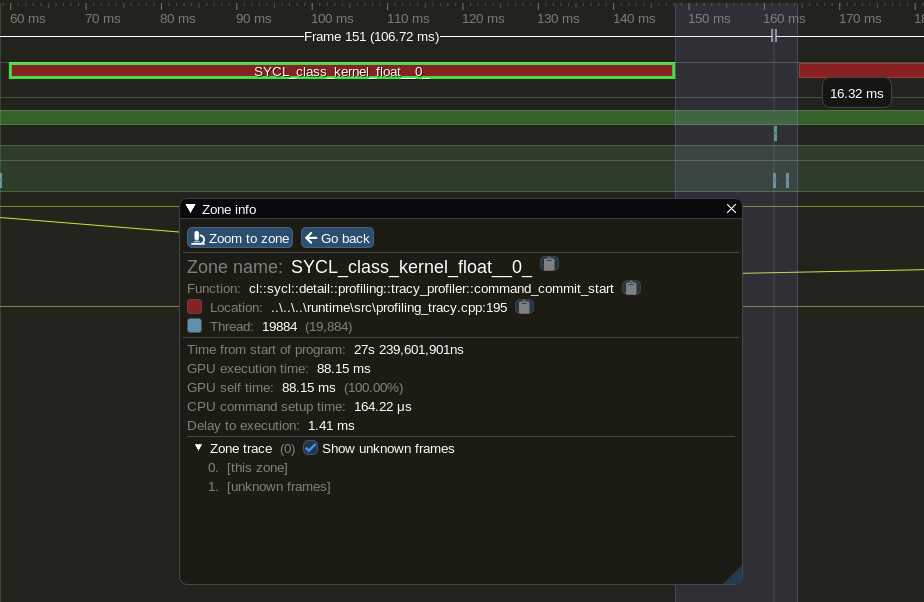
By zooming in in a region between kernels we can see a gap of 16ms. This appears to be a long time that the GPU spends idle. This application is mapping the buffers to update the OpenGL buffers so everything can be drawn to the screen. The mapping is a blocking operation which means that the GPU is not doing any computation, thus, idling its execution units.
ComputeCpp can better utilize a device when several pieces of work are submitted in sequence, without any synchronization in between. To reduce the gap in between kernels of the NBody application we can change the code so it performs several simulation steps before synchronizing the data for drawing. This can be performed by calling the step function many times. This will cause ComputeCpp to fast-enqueue multiple kernels at once, allowing the scheduler to execute them as soon as possible. Let's make the change:
for (int32_t step = 0; step < m_num_updates_per_frame; ++step) {
  m_sim.step();
}
Let's analyze a profiling session when m_num_updates_per_frame = 5.
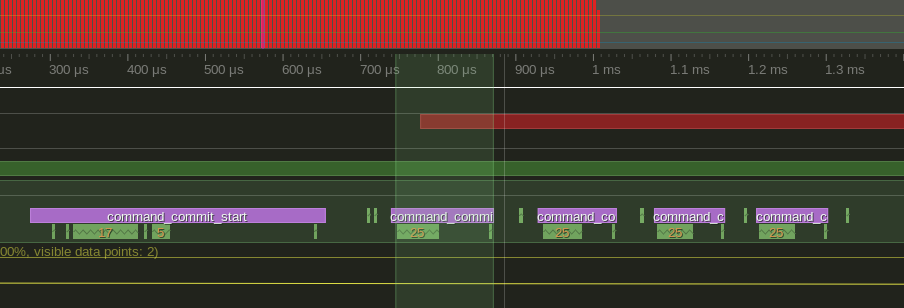
By launching several kernels in a loop like this, ComputeCpp can fast-enqueue the kernels. This means that all launches are going to be grouped, see how this looks in the following image:
Now, for the final look in the gap in between kernels:
A 5x reduction in idling time, not bad.
GPU Performance Counters
Tracy supports plotting time series data and we leverage this capability to display
performance counter data from supported devices. To enable this feature simply add
enable_perf_counters_profiling = true to your configuration file. If ComputeCpp can read
performance counters from the device that kernels are being executed on, they will be
displayed bellow the timeline.
A known limitation of the current implementation is that we only support one sample per kernel launch but we are working towards proving time-based sampling of performance counter data. Another limitation is that we only support Intel GPU devices, but ARM Mali support is coming in the near future.
So far we have assumed that kernel times cannot be reduced further, so improving the gap in between kernels was the only available optimization. However this is not quite true. Let's focus on the Gravity simulation kernel to see what we can do to improve it. The gravity kernel can be summarized as follows:
sycl::range<1> range(m_n_bodies);
cgh.parallel_for<kernel<num_t, 0>>(range, [=](cl::sycl::item<1> item) {
    for (size_t i = 0; i < n_bodies; i++) {
        const vec3<num_t> diff = pos[i] - x;
        const num_t r = sycl::length(diff);
        acc += diff / (r * r * r + num_t(1e24) * num_t(i == id) + damping);
    }
});
This will launch a kernel with 1 thread per body and each thread will iterate over all the bodies calculating interactions, giving this algorithm complexity of O(N²). However, due to the nature of the interactions, we can make use of the local memory of each work-group so that all threads in a work-group are able to calculate the interactions with a tile of bodies, thus, confining memory accesses to the work-group local memory.
Here is the tiled gravity kernel:
sycl::range<1> global(m_n_bodies);
sycl::range<1> local(m_tileSize);
sycl::nd_range range(global, local);
cgh.parallel_for<kernel<num_t, 0>>(range, [=](cl::sycl::nd_item<1> item) {
     size_t localId = item.get_local_id()[0];
     size_t groupId = item.get_group_linear_id();
     size_t numGroups = item.get_local_range()[0];
     size_t groupRange = item.get_group_range(0);
    for (size_t i = 0, tile = 0; i < n_bodies; i += tileSize, tile++) {
        // Load a tile of data to the local memory and synchronize
        shared[localId] = pos[((groupId + tile) % groupRange) * numGroups + localId];
        item.barrier(sycl::access::fence_space::local_space);
        // Calculate the interations within the tile
        for (size_t j = 0; j < tileSize; ++j) {
            const vec3<num_t> diff = shared[j] - x;
            const num_t r = sycl::length(diff);
            acc += diff / (r * r * r + num_t{1e24} * static_cast<num_t>(r == num_t{0}) + damping);
        }
        // synchronize all threads in a work-group
        item.barrier(sycl::access::fence_space::local_space);
    }
});
The application was also modified to allow the tile size to be changed dynamically so we can see the performance counters for different tile sizes in the same image. To demonstrate that we can improve performance by changing the memory pattern access of a SYCL application, let's examine a capture of a simulation with 16k bodies.
| -- | Normal | 32 | 64 | 128 | 256 |
|---|---|---|---|---|---|
| Average Kernel Times | 81ms | 75ms | 72ms | 71ms | 73ms |
The columns indicate the kernel times with different tile sizes.
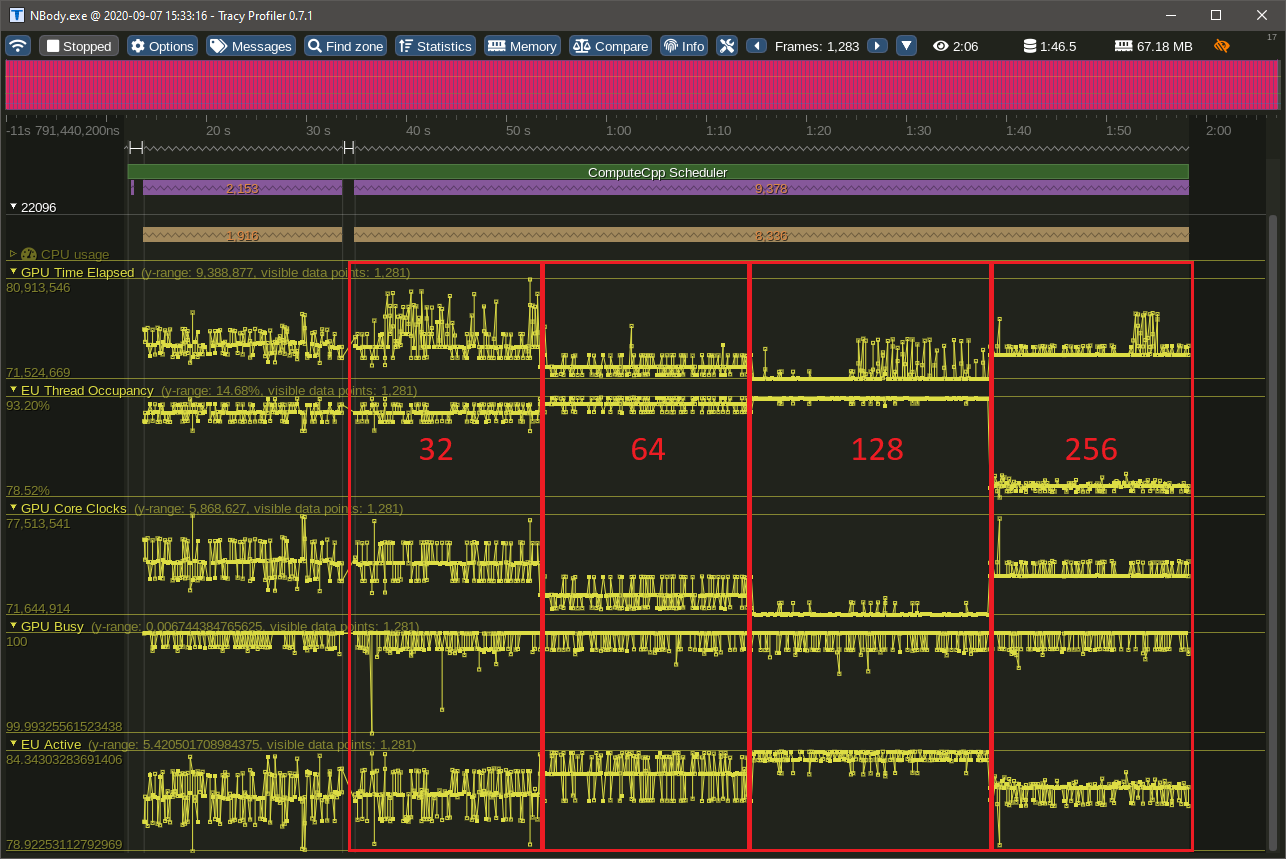
Comparing the kernel times between the normal and the best tiled case we can see a 13% reduction in kernel execution time. Let's now take a look in the performance counters of our application. In the following image the different tile sizes are highlighted, showing the impact that it can have on the simulation. There are many counters not shown here, but these are the important ones to look at first.
The GPU Busy counter shows the percentage of time that the GPU was utilized. We can see that our kernels can fully utilize the GPU most of the time, a good sign our application can saturate the GPU with work. The next counter we can look is the GPU Time Elapsed which basically shows how much time a kernel took to execute in the GPU. We can clearly see that by changing the tile size we get different averages for this counter, and the lowest average we get is from using a tile size of 128. Remember that the tile size is reflected in the number of work-items in a work-group, so by selecting a tile size with the lowest GPU Core Clocks value we get a kernel that can perform more with less clocks, thus improving efficiency. The EU Active and EU Thread Occupancy are another two counters that indicate efficiency. Most of the time we want a kernel that fully occupies the GPU and can see that by using a tile size of 128 we get almost a steady line of 93% occupancy.
It is also clear that the occupancy falls quite drastically when we use a tile size of 256. This means that the GPU in question is not able to process 256 work-items in a work-group with the same efficiency, indicating that we are trying to schedule more work than the GPU can handle at once.
Conclusion
Profiling is an important part of software development and Codeplay are constantly working to improve out-of-the-box profiling support in ComputeCpp. By embedding Tracy in ComputeCpp you get a performant profiler that has many interesting features and can help you optimize your application to meet your targets.
Tracy has several features now shown in this blog post and we are planning on writing more tips and tricks for finding potential performance problems in applications using ComputeCpp.
If you are interested in ComputeCpp Professional Edition then get in touch with us and we can tell you more about it. If you want to learn more about ComputeCpp then visit our developer website.

