LLDB MI Driver - Part 2: Setting Up the Driver
08 August 2014
Articles in this series
- Part 1: Intro
- Part 2: Setting Up the Driver
- Part 3: The Design
- Part 4: How to Add a Command
1 Introduction
In this blog post, the second in this series on the MI Driver, we will show how to use it from the Eclipse IDE to debug a remote target. So far, the MI Driver has only been tested with Eclipse, however it should work with any IDE that supports the GDB/MI protocol.
The LLDB Machine Interface (MI) Driver is a standalone executable that sits between an IDE and a debug server. Figure 1 shows a typical scenario.
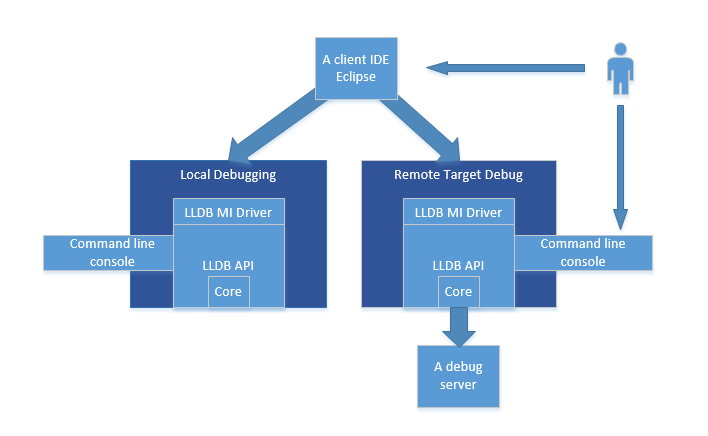
Figure 1: MI Driver usage scenario
In the case of remote debugging, the MI Driver can be set up from an IDE to connect to a remote debug server. At the time of writing this blog post, the MI Driver is currently at version 1.0.0.9, and does not yet support debugging from the command line. The functionality is present in the Driver to support this mode, but it has not yet been tested and, as such, is currently disabled.
In this blog post, we will concentrate on setting up the MI Driver to work with the Eclipse IDE.
2 Setting Up Eclipse
The following set up instructions rely on Eclipse 4.2.0 (Juno). They describe how to set up a remote debug session using a debug server. You can use any debug server that is compatible with LLDB.
It is assumed that you already have Eclipse installed, with all of the necessary pre-requisites to enable compilation and debugging of C and C++ code. You can download Eclipse 4.2.0 from the Eclipse Project. You may also need to download the Eclipse C/C++ Development Tools (CDT) plugin.
2.1 Getting the Code
The code for the MI Driver can be downloaded as part of the LLDB project's source code, and the lldb-mi project is built as part of a full LLVM build. Please refer to the official LLDB build instructions when compiling LLDB.
After compilation, the lldb-mi executable will be located in the bin directory of the LLVM build folder.
2.2 Creating a Project for Remote Debugging
The follow steps describe how to create a new C++ project for a simple Hello World application. Once the project is set up, a Debug Configuration will be created to allow us to debug the Hello World application using the MI Driver.
1. In Eclipse, navigate to File ? New Project ? C/C++ ? 'C++' Project.
2. Give the project a name, select 'Hello World C++ Project' under executable, select a toolchain e.g. MinGW GCC (Linux GCC on Unix), and then click the 'Finish' button.
3. Build the project by navigating to Project ? Build All .
4. Open the 'Debug Configurations' window by navigating to Run ? Debug Configurations
5. Now, create a new instance of a 'C/C++ Remote Application'. See Figure 2.
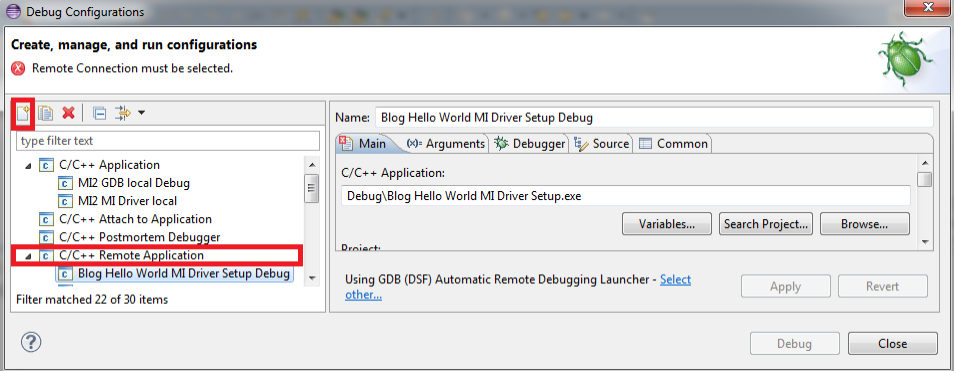
Figure 2: Create a remote application
6. Add the executable’s path to the 'C/C++ Application' text box.
7. Click on the 'Debugger' tab.
8. In the 'Main' window pane, add the lldb-mi executable's path to the 'GDB Debugger:' text box.
9. At the bottom of the same page, click on 'Select other...' (near the 'Apply' button). A 'Select Preferred Launcher' dialogue will pop up. Click the 'Use configuration specific settings' tick box and then highlight 'GDB (DSF) Manual Remote Debugger Launcher' in the list. See Figure 3.
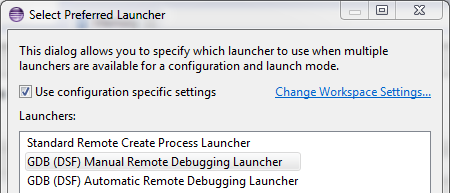
Figure 3: Select preferred launcher
10. Click the 'OK' button and return to the previous dialogue.
11. Click the 'Connection' tab to reveal the pane to set the TCP/IP port number. Your can enter any preferred number, but here we will use 1240 for the port number.
12. That's it for the Debug Configuration, the set up of your project is complete.
2.3 Debugging the Project
At this stage, you should have a Hello World executable. Make sure that the file exists and that, for example, your anti-virus software has not decided to quarantine it.
To be sure that we are able to debug the Hello World program, put a breakpoint in the code just after main().
From the command line, start your debug server using the TCP/IP port number entered earlier. For example, port 1240 was used above.
From Eclipse's main toolbar, select the Debugger and choose the Debug Configuration that you just created, for example: 'Blog Hello World MI Driver Setup'. A debug session will be launched, and the code will execute, stopping at the breakpoint.
2.4 Tracing MI Commands
If you wish, you can see the communication between Eclipse and the MI Driver by looking in Eclipse's Console view. Open a Console view, then select the 'gdb traces' view using the 'Display Selected Console' drop-down menu button. The MI commands that have been issued will be revealed, as shown in Figure 4.
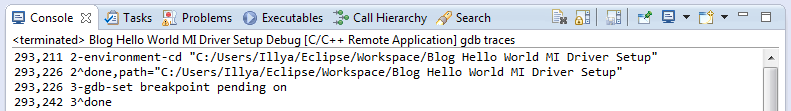
Figure 4: MI command trace
3 Conclusion
This blog post has given a brief overview of the steps required to set up Eclipse to use the LLDB MI Driver. For more information on the MI Driver's design, see the next post in the series, Part 3: The Design.